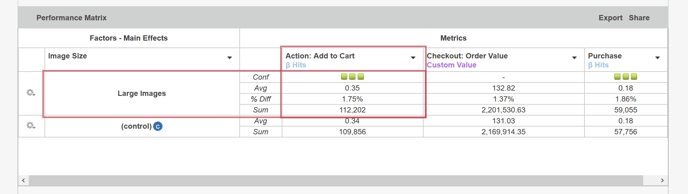
The Performance Matrix displays the performance of each Metric in the Campaign relative to the Variations that the users in each Variation Group see. It provides a variety of powerful tools to assist you in determining exactly how users are responding to each of your tested Variations, individually and in combination.
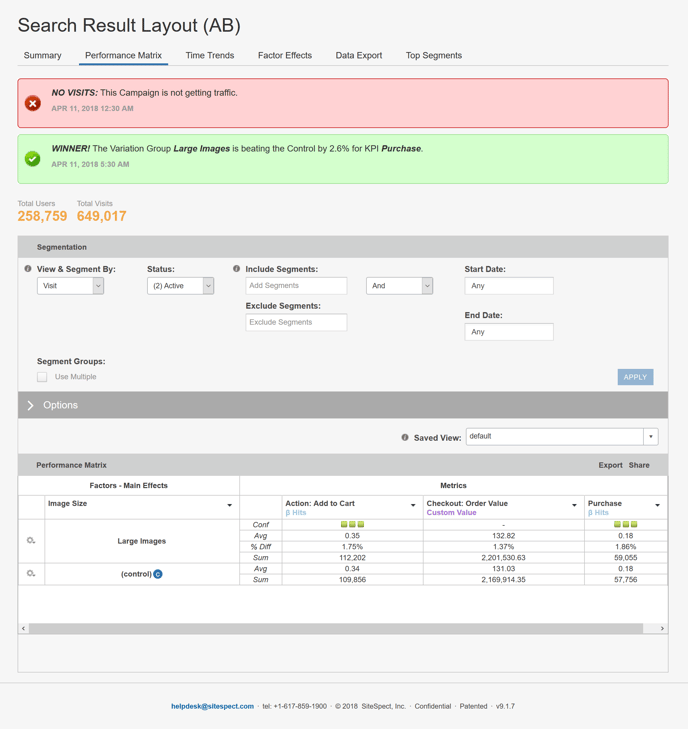
The report is set up as a matrix and contains a great deal of information. At first glance, it may be difficult to take it all in, but if you break it down into sections, it becomes more clear.
Report Heading
The top of the report displays its settings and options. Settings are described in Report Settings. Options are described in Performance Matrix Report Options.
Report Body
The left side of the matrix displays Factors as column titles with each of its Variations displayed below the Factor name.
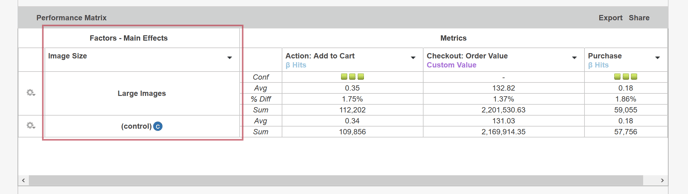
Look at the column called Image Size, which is a Factor in the Campaign selected for the current report. As you follow the column down the page, you can see that it lists a Variation called Large Images.
The right side of the matrix displays Metrics as column titles.
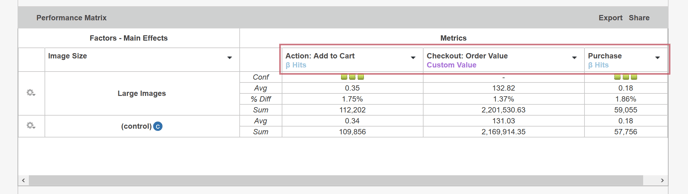
You can follow each Variation row across the report page to see how it performed at each Metric. The following image shows how one Variation, Large Images, intersects with a Metric called Action: Add to Cart.
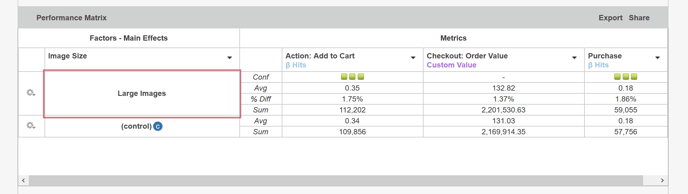
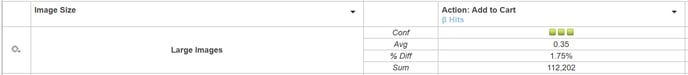
Each Variation row contains several sub-rows that report specific statistics. SiteSpect tracks many different measurements for the Variation, but displays only those selected in the Options section of the Report Heading. The following image shows the four sub-rows for the Variation called Large Images.
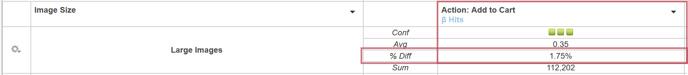
If you follow one of the sub-rows across the page, you can see how that measurement intersects with the column for a Metric. The following image shows how the % Diff for the Variation Large Images intersects with the Metric called Action: Add to Cart.
As you become more familiar with SiteSpect reporting, you will be able to determine precisely what you want to report and how to use the Report Settings and Options to display them.
Using the Variations Settings Menu
At the left end of each Variation row is a Settings menu available when you click the gear icon.
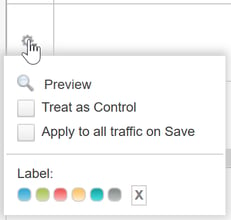
You can use this menu to:
- Preview the Variation on the Site.
- Select the current Variation to be used as the control.
- Apply this Variation to all traffic.
- Apply a color to the row for easier viewing.