The Key Performance Indicator (KPI) Summary allows you to view a snapshot of a Campaign's performance on the Campaign List page without having to create a report. The KPI Summary provides information on currently running Campaigns as well as Campaigns that have finished.
The following are displayed in the KPI Summary column:
-
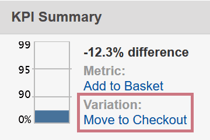
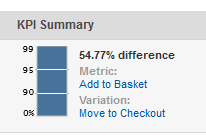
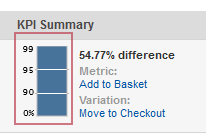
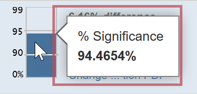
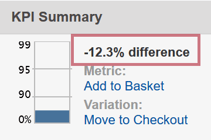
The bar graph displays statistical significance, which is the significance or confidence of the winning Variation as compared to the Control Group. It has three ranges: 0-90% in the bottom third, 90-95% in the middle third, and 95-99% in the top third.
Hover your mouse over the bar graph to display the specific percentage of significance.
-
The % difference is the percentage of difference between the winning Variation compared to the Control Group.
-
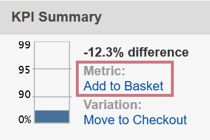
The Metric listed is the KPI selected for the Campaign. It can be a regular Metric or a Calculation that uses several Metrics in calculations to create a weighted score for the KPI.
-
The Winning Variation listed is the Variation with the largest % difference when comparing the KPI to the Control Group over the past 90 days of the Campaign.