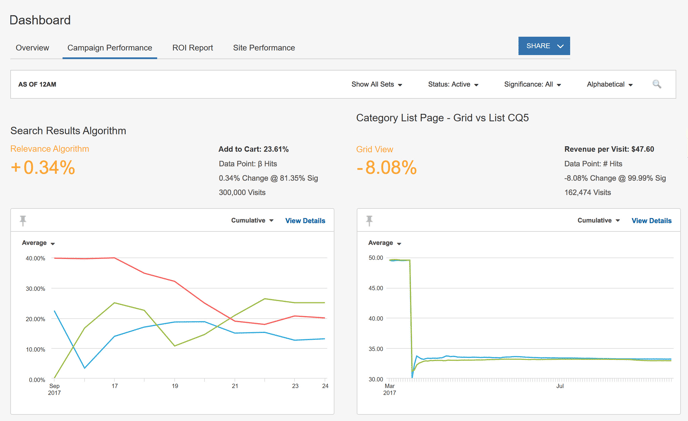
The Campaign Performance page is a part of the SiteSpect Dashboard that allows you to view graphs and data on the top five Variation Groups for each Campaign of the selected Status. To see the Campaign Performance page, select Dashboard from the left nav and then select Campaign Performance.
Each graph displays Campaign data for top performing Variation Groups as of midnight and is updated daily.
Choosing Display Options
In the upper right corner of the page, there are several drop-down lists that allows you to choose what to display how to display it.
- The Sets drop-down lets you choose to display one Set or All Sets.
- The Status drop-down lets you specify Campaigns to display by their Status.
- The Significance drop-down lets you specify what Campaigns to display by level of statistical significance.
- The Sort drop-down lets you specify an order for displaying Campaigns.
Reading the Data
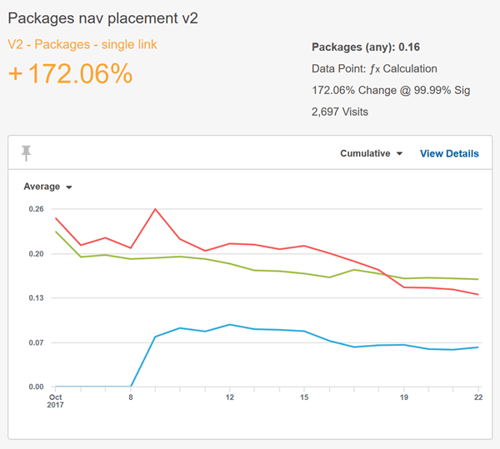
For each Campaign on the Dashboard, SiteSpect displays the data for the top five Segments, including:
- The name of the Campaign
- The name of the Variation Group
- The percentage of Change
- The Metric for the Campaign
- The selected Data Point. You can select the Data Point displayed by clicking View Details, then click the Settings gear in the upper right corner of the page.
- The percentage of change at the specific significance
- The number of visits
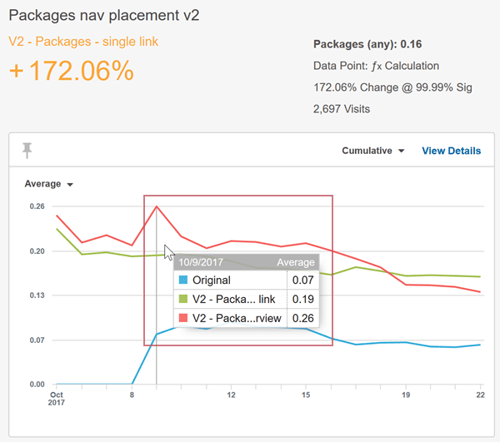
The chart displays one line for each Variation Group in the Campaign as well as one line for the Control Group. When you hover your mouse over the graph, a pop-up window displays the statistics for the mouse location on the graph.
Determining how to Display Data Points
Use the drop-down at the top of the graph to determine what to display for each data point on the graph.
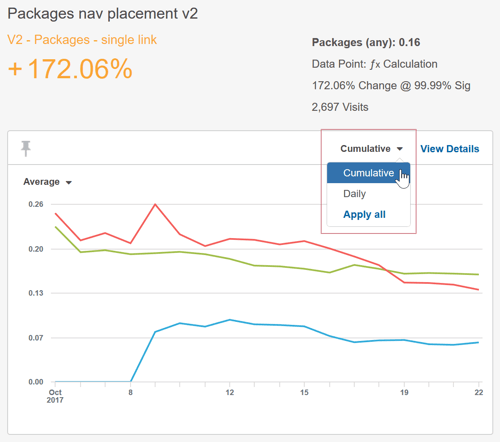
- Cumulative – Each point on the graph includes all previous days' data.
- Daily – Each point on the graph shows one day's data.
- Apply all – Applies your selection to all graphs on the page.
Viewing More Detail
Click View Details in the upper right corner of the graph to open the Top Segments page.