SiteSpect Top Segments feature allows you to analyze the results of the top five Segments in a selected Campaign all on one page. The report is updated daily and loads immediately upon request. It also allows you to set a default view for all your Campaigns.
To view the Top Segments page:
- Select Campaigns, then select a Campaign Status.
- Select the Campaign whose Top Segments you want to review.
- Select Analytics, then Top Segments. The Top Segments page opens.
Viewing the Top Segments Page
The Top Segments page lists a Summary at the top and Segment information just under that.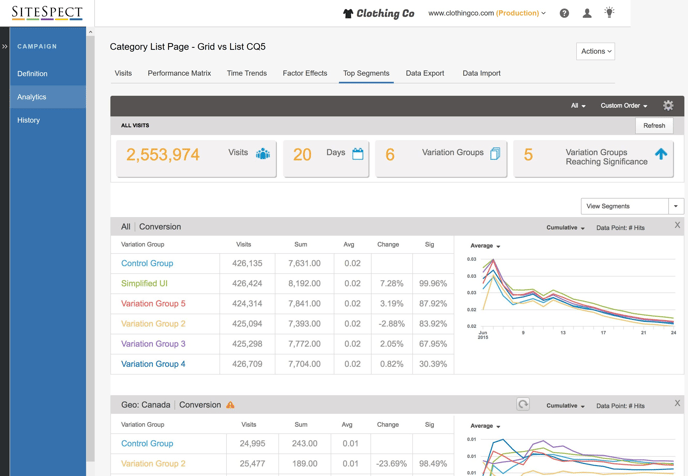
Summary for Campaign
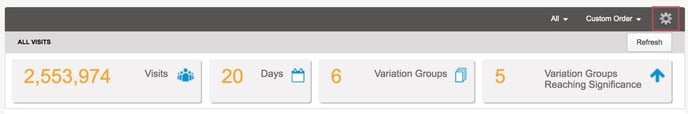
The top of the Top Segments page displays a summary for the Campaign you have selected:
- Visits – Lists the number of visits all your visitors have made to your website. This number includes duplicate visits by the same visitor, so if one visitor makes three visits, SiteSpect counts that as three Visits.
- Days – Lists the number of days the Campaign was or has been active.
- Variation Groups – Lists the number of Variation Groups that are part of the Campaign.
- Variation Groups Reaching Significance – Lists the number of Variation Groups that are reaching statistical significance.
The top bar contains a drop-down that lets you choose all Segments or only those Segments that reach the selected significance. A second drop-down lets you choose a sort order for the Segments.
Configure Campaign
At the top right corner of the top bar, there is a little Gear icon.
Click the Gear icon to open the Configure Top Segments page. To learn more about this page, read Configuring Top Segments.
Refresh
The page is normally updated daily, but you can get updated information by clicking the Refresh button.
Segment Data
Just above the Segment Data is a drop-down that allows you to choose all of the Segments or select from among the top five.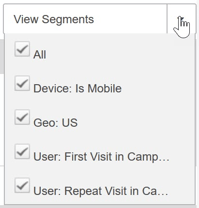
After the summary area at the top, the page lists each of the Top Segments in its own section. Each section looks like the following:
The gray bar at the top of the Segment section lists:
- The Metric you have chosen on the Top Segments Configuration page.
- The Segment whose data is displayed in this section.
- A Refresh button.
- Graph rendering selection:
- Cumulative – Each day shows the average for all days prior to that day, including the day.
- Daily – Each day is its own data point; it shows the average for that day.
- Apply All – Apply your selection to all of the Top Segments.
- The Data Point you selected on the Top Segment Configuration page.
- A close icon, X, that allows you to close this Segment's page section.
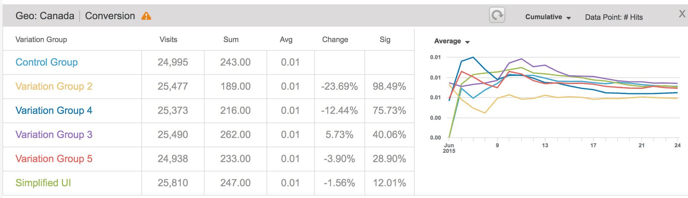
The body of the Segment section is divided into two sections: the left side is a table that displays the data for the Variation group and the right side displays the data in a graph over time.
In the table area, the top row always displays the Control Group in blue text. For the Control Group, SiteSpect displays:
- Visits – The number of visits assigned to this group.
- Average – For Totals, it's the average number of hits per visit; for Uniques, it's the percentage of Visits that triggered the selected Metric.
The rows that follow display data on the Variation Groups that are part of the selected Campaign. For each Variation Group, SiteSpect displays:
- Visits – The number of visits assigned to this group. If a single user visited several times, each Visit is counted.
- Sum – The total number
- Average – For Totals, it's the average number of hits per visit; for Uniques, it's the percentage of Visits that triggered the selected Metric.
- Change – The percentage of difference between the winning Variation Group compared to the Control Group.
- Significance – This column reports the statistical significance of the Variation Group. Significance lets you know that you have potentially a large enough sample to trust the figures.
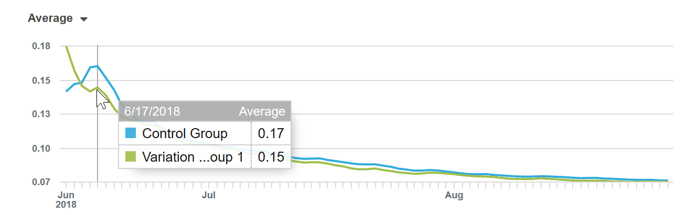
The graph displays a line for each row of the Variation Group table, drawn over time. Use the drop-down to select what you want the line to display:
- % Change – The percentage of difference between the winning Variation Group compared to the Control Group.
- Average (the default) – For Totals, it's the average number of hits per visit; for Uniques, it's the percentage of Visits that triggered the selected Metric.
- Apply All – Apply your selection to all of the Top Segments graphs.
To view the value of a line, move your mouse pointer over the graph. A pop-up window opens displaying the data at that very point in time.