SiteSpect uses standard statistical methods to evaluate data. It then displays the results of that analysis on reports. This topic explains some basic information about terms from statistics and how we use them in SiteSpect.
Hypothesis Testing
When we conduct experiments in the form of A/B tests we are using a method known as hypothesis testing. A hypothesis test is a method of statistical inference that compares two data sets in an attempt to establish a causal relationship between variables: manipulating an independent variable to assess its effect upon a dependent variable. For example, you can change the headline, an independent variable, to determine its effect on conversion rate, a dependent variable.
Null Hypothesis
The Null Hypothesis says that there is no relationship between the variables. That is, manipulating the independent variable does not affect the dependent variable. This is the hypothesis that SiteSpect seeks to disprove. In a simplified way, the null hypothesis says that the mean of A is equal to the mean of B.
Alternative Hypothesis
The Alternative Hypothesis says that there is a relationship between the variables: manipulating the independent variable does affect the dependent variable. This is the hypothesis that SiteSpect seeks to validate. In a simplified way, the alternative hypothesis says that the mean of A is not equal to the mean of B.
Statistics of Testing
We use statistics to determine if an observed difference between data sets is unlikely according to a certain probability threshold. SiteSpect tests a sample of the visitors to your site to see if the change you design affects conversion. In other words: it helps you understand the probability that the observed difference is due to random chance. In SiteSpect terms: what is the probability that the difference between the Control and a Variation is due to chance? SiteSpect uses a test that compares two samples: the Control and the Variation.
Z-Score
The z-score calculates the distance from the Control mean to the Variation mean in units of the standard error. Standard error is a measure of the statistical accuracy of an estimate equal to the standard deviation of the theoretical distribution of a large population of such estimates.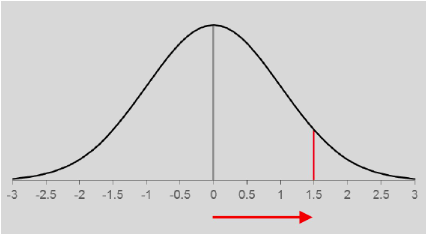
In the illustration below, the Variation mean is 1.5 standard deviations above the Control mean. From the z-score, you can determine the probability that the Variation exhibits this difference from the Control due to chance alone: this probability is the p-value.
P-Value
The p-value is the probability of getting a value of the test statistic that is at least as extreme as the observed test statistic by chance alone, if the null hypothesis is true. In other words, it is the probability of wrongly concluding that there is a difference between groups when, in fact, there is no difference. In this example, at 1.5 standard deviations above the Control mean, there is
approximately 13.4% probability that the difference compared to the Control is due to chance alone.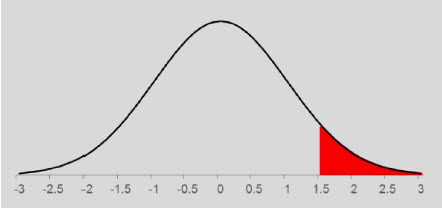
The p-value that is commonly used as the threshold is 0.05, which means that we are willing to accept a 5% probability of declaring one group to be different from the other when there is no true difference (false positive). This equates to a 1 in 20 chance
The % Significance Avg displayed in SiteSpect’s reporting is defined as 1-p. A p-value of 0.05 equates to 95% Significance. Other p-values that are also used somewhat frequently are 0.10 (90% Significance, a 1 in 10 chance of false positive) and 0.01 (99% Significance, a 1 in 100 chance of false positive).
If the p-value associated with the test statistic is less than the p-value that you’re using as the threshold (e.g. 0.01, 0.05, or 0.10), then we reject the null hypothesis and accept the alternative hypothesis.
SiteSpect Statistical A/B Test Methodology
SiteSpect uses a two-tailed t-test when comparing Variations against Controls to determine the point at which confidence intervals do not overlap and thus indicate significance . SiteSpect also computes the z-score and uses it in reports
SiteSpect uses the results of the two-tailed t-test as the basis for the Confidence Indicator bars in the Performance Matrix. We calculate confidence intervals using a z of 1.64485 (for “90%”, shown as one red/green bar), 1.95996 (for “95%”, shown as two red/green bars), and 2.57583 (for “99%”, shown as three red/green bars) of the Variation vs. the Control. For main effects, SiteSpect does this once for each pair of a Factor’s Variations vs. its Control. For interaction effects, SiteSpect does this once for each pair of an entire Variation Group vs. the Control Variation Group. For each of these comparison tests, SiteSpect looks for whether the entire interval is below zero or above zero (hence two-tailed), and if so, it is considered significant at the given z.
Lastly, SiteSpect displays Confidence Plots, which are basically a visual comparison of confidence intervals with a z of 1.281552 (equivalent to an “80%” level of significance.) Notably, when intervals at this level reach the point of being non-overlapping (the highest value for the Control is lower than the lowest value for the Variation, or vice versa), it is equivalent to a p of 0.05 (95% confidence).