FAQs
- How can I tell that my site traffic is routing through SiteSpect?
- Can we access our original page that our origin is serving, even when 100% of our site traffic is routing through SiteSpect?
- What is the SSLB cookie?
- How do I know if I’m assigned to a SiteSpect Campaign?
- What is the /_ssobj path that we see?
- Why does SiteSpect display this timeout message: “We're sorry, the link that you clicked on could not be served. We are experiencing a temporary delay due to high volume. Please click RELOAD and try again. We apologize for the inconvenience.”?
- What are 50x responses when it comes to SiteSpect?
- How can I Identify site visitor IP address?
- How do we pull access logs from SiteSpect?
- What is Bypass mode?
- Under what circumstances is Bypass mode automatically triggered?
- How can I tell if my site is bypassed?
- How can I use Log Visualizations to troubleshoot any traffic issues?
How can I tell that my site traffic is routing through SiteSpect?
The presence of the RTSS response header indicates that traffic is being routed through SiteSpect. RTSS means “Routed Through SiteSpect.” If that header is missing, the request/response did not route through SiteSpect.
However, if you suspect that you’re seeing a cached page (and that the RTSS header is from cache and not live), you can request the same page two or three times. The RTSS header’s value should change. If it never changes, you are looking at a cached page, not a page from SiteSpect.
Can we access the original page that our origin is serving even when 100% of our site traffic is routing through SiteSpect?
You can, as long as your origin accepts direct requests.
To go to the unmodified page that your origin is serving, without routing traffic through SiteSpect, you can modify your local hosts file to force traffic for that domain to go to a certain IP address.
For example, if the origin IP is 63.2.3.4, and the hostname is www.example.com, add the following entry into your host file:
# Go to the Origin for www.example.com
63.2.3.4 www.example.com
What is the SSLB cookie?
The SSLB cookie is an optional feature that SiteSpect uses to send routing information to a client’s CDN.
Please note that the SSLB cookie is an optional feature, and if it is not part of your site’s configuration, the SSLB cookie will do nothing. Also, your CDN needs to be configured to use that cookie.
If the SSLB cookie *is* configured, this is how it works: when a user is routed through SiteSpect and is assigned to a Campaign, SiteSpect sets their SSLB cookie to 1. The user keeps this Cookie Value until they are no longer assigned to any Campaign. If a user is not assigned to a Campaign, SiteSpect sets their SSLB cookie to 0. When the client’s CDN sees that SSLB is set to zero, it should route the request directly to the client’s origin, rather than to SiteSpect.
How do I know if I’m assigned to a SiteSpect Campaign?
The SSSC cookie is a Status Signaling Cookie, a session-only cookie, used to send the user's Campaign assignment information to the backend web server. It contains the campaign and variation group pairs of IDs for each campaign the user is assigned to.
What is the /_ssobj path that we see?
/__ssobj is the SiteSpect directory for objects stored on SiteSpect systems.
Why does SiteSpect display this timeout message: “We're sorry, the link that you clicked on could not be served. We are experiencing a temporary delay due to high volume. Please click RELOAD and try again. We apologize for the inconvenience.”?
Although this error message is served by SiteSpect, it is not a SiteSpect error. What it tells us is that SiteSpect was not able to connect to your origin.
SiteSpect is designed to proactively close connections and display a message to alert users whenever either of the following two conditions occur:
- SiteSpect establishes an HTTP connection with your origin and the origin does not respond with any data within a predefined period (the default is 60 seconds).
- SiteSpect is not able to establish a TCP connection with the origin.
The timeout message is configurable. Contact the SiteSpect Help Desk at <helpdesk@sitespect.com> to customize this timeout message.
What are 50x responses when it comes to SiteSpect?
50x responses are error states in which visitor traffic does not proxy correctly. The server is aware that it has encountered an error or is otherwise incapable of performing the request.
There are three classes of 5xx errors observed through SiteSpect:
- SiteSpect was unable to reach the origin.
- SiteSpect was able to reach the origin but the origin (or a device in between) severed the connection with a 50x error.
- SiteSpect reached the origin and timed out the connection due to inactivity.
How can I Identify site visitor IP address?
Because SiteSpect works as a reverse proxy, it can appear to your origin that all requests to your site come from SiteSpect.
SiteSpect maintains the original end-user’s IP address in the X-Forwarded-For request header, which is a common method used by HTTP proxies. That header may present either as a single IP address or a comma delimited list of IP addresses. Your systems should inspect and use the left most value when a list of values is presented or the single value when only one is present.
SiteSpect can also be configured to send a custom request header with the end-user’s IP address.
How do we pull access logs from SiteSpect?
You can pull the access logs using the SiteSpect interface if you are a Campaign Administrator. To do so, select: Site > Monitoring > Log Files.
You can also download logs using the Admin API. Go to https://developers.sitespect.com for more information.
What is Bypass mode?
Bypass mode is a safety feature built into SiteSpect. It allows you to remove SiteSpect from your production traffic flow in a way that does not affect your visitor’s ability to navigate your site. To initiate Bypass mode, you or a SiteSpect team member can put the site into Bypass.
During bypass, traffic does not come to SiteSpect at all. We do not receive any requests for your site; they are sent directly to your origin.
SiteSpect will invoke Bypass mode automatically if your site’s health check is unavailable. This can happen if there are routing or connection issues, or if you accidentally removed or renamed the healthcheck target.
Once the health check becomes available again, and is returning a 200 status, the bypass will automatically be removed.
There is another, separate trigger for automatic bypass which we call slow-origin bypass. This is triggered by a buildup of open connections to your site in more than one of our data centers.
Open connections in themselves are not a bad thing. They are not a problem in themselves. In fact, SiteSpect will re-use open connections whenever possible.
The problem appears when the open connections remain open until they time out, which (depending on your site’s configuration) could be one or two minutes.
When that situation appears in only one of our data centers, we will route requests to another of our data centers until the problem clears.
However, if the problem appears in one or more of our data centers, it suggests that the problem is with the origin, and a slow-origin bypass is invoked to allow the standing connections to timeout and clear.
The slow-origin bypass is removed by a timer. The first occurrence lasts five minutes. Each successive call is longer. If the slow-origin bypass continues to be invoked, a manual removal of bypass will be required.
Under what circumstances is Bypass mode automatically triggered?
The SiteSpect Cloud is designed to automatically bypass your site under two conditions conditions:
The SiteSpect Healthcheck target is unavailable or returns any status other than 200. The healthcheck target is a small file that sits on your origin. SiteSpect continuously monitors this file. If the healthcheck is unavailable, or is returning a status other than 200, it can be for a variety of reasons:
- Connection issues: if SiteSpect can’t reach your origin, or if your origin takes too long to respond, we can’t reach your healthcheck target.
- You’ve set a redirect to the healthcheck. If the healthcheck returns a 30x status, it will cause bypass.
- Healthcheck removed or renamed. This often happens after a client’s new release.
There is also another type of bypass, called slow-origin bypass which is triggered in an entirely different way, unrelated to the healthcheck target. This type of bypass is triggered if there is a build up of connections to your origin that – instead of receiving responses from your site, instead hang around until they timeout. If this build up occurs in two or more of SiteSpect's data centers, we invoke a temporary bypass to allow the connections to timeout and clear.
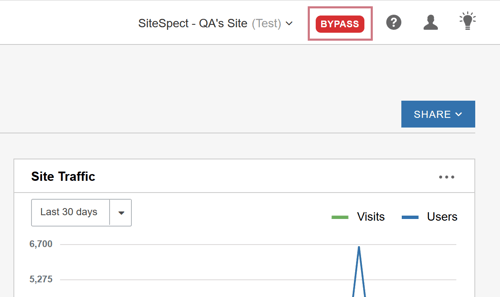
How can I tell if my site is in Bypass?
To see if your site is in Bypass mode, please look under the domains configuration tab, SiteSpect displays a Bypass indicator if your domain is in Bypass.
How can I use Log Visualizations to troubleshoot any traffic issues?
In SiteSpect’s control panel there is a log visualization tool for each site. You can find it by clicking Dashboard > Site Performance.
This tool provides a sample of the site’s logs from the past two weeks. It displays data both in graphic form, and in line-by-line logs (which you can by scrolling down the page).
While this tool can provide valuable insight into your site’s traffic and performance, it is at the same time somewhat complex. If you would like an introduction to this tool, please contact our helpdesk (via email at helpdesk@sitespect.com).