The Site Traffic page graphs several statistics about visits to your Site within a specified date range. It displays data on traffic from the last 30 days, unless you use the Date Range drop-down to specify a different length of time.
The top of the page lists totals for several categories. This gives you a quick glance at the data available in the graphs. There are three separate graphs: Visits, Users, and Robots. Each one displays data from its own perspective.
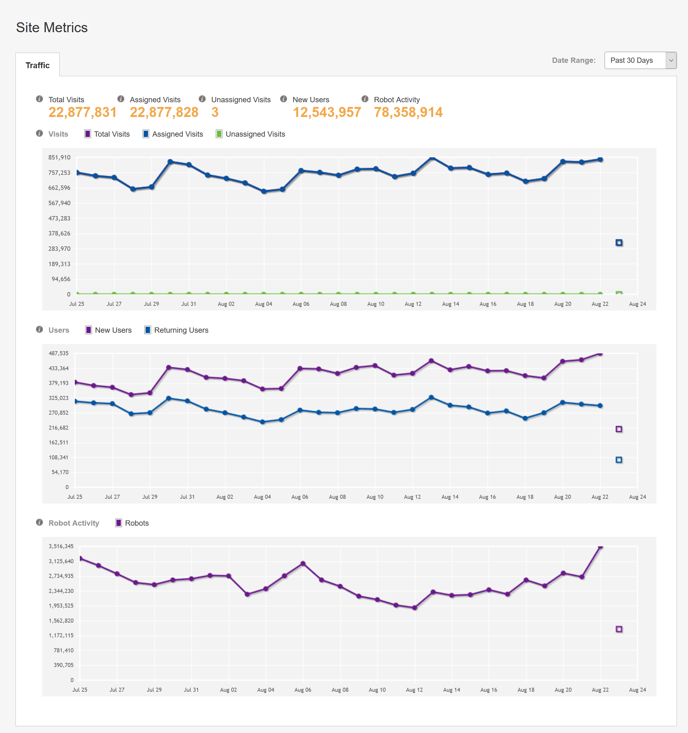
Header Data
The following table describes the data at the top of the page.
| Field | Description |
|---|---|
| Total Visits | Total Visits represents the sum of all Visits to the Site within the selected Date Range. |
| Assigned Visits | Assigned Visits represents the sum of all Visits that have been assigned to one or more Campaigns within the selected Date Range. |
| Unassigned Visits | Unassigned Visits represents the sum of all Visits that have NOT been assigned to any campaigns within the selected Date Range. |
| New Users | New Users represents the sum of all new Users to the Site within the selected Date Range. |
| Robot Activity | Robot Activity represents the sum of failed SSARD probes for the Site within the selected Date Range. |
Visits Graph
The Visits graph represents Visits to the Site over the selected Date Range. Solid-square data points represent data for completed days; open-square data points in the rightmost column show the current partial day. The graph plots three lines.
| Line | Description |
|---|---|
| Total Visits | Shown as a purple line that represents the total number of new Visits to the Site each day. The scale is indicated on the left axis. |
| Assigned Visits | Shown as a blue line that represents the total number of Visits to the site that were not assigned to any Campaigns. The scale is indicated on the left axis. |
| Unassigned Visits | Shown as a green line that represents the total number of Visits to the Site that were not assigned to any Campaigns. The scale is indicated on the left axis. |
Users Graph
The Users graph represents User activity to the Site over the selected Date Range. Solid-square data points represent data for completed days; open-square data points in the rightmost column show the current partial day. Two lines are plotted:
| Line | Description |
|---|---|
| New Users | Shown as a purple line that represents the total number of new Users to the Site each day. The scale is indicated on the left axis. |
| Returning Users | Shown as a blue line that represents the total number of Users that have returned to the site each day. The scale is indicated on the left axis. |
Robot Activity Graph
The Robot Activity graph displays the amount of site activity that is attributable to cloaked robots, crawlers, and other non-human web agents. (By cloaked, we mean that the activity didn't meet SiteSpect's explicit pass-through settings, which typically filter out all identifiable robots including Google, Yahoo, Bing, etc.) The data shown here approximates the number of individual pages requested by cloaked robots. Solid-square data points represent data for completed days; open-square data points in the rightmost column show the current partial day.
SiteSpect detects robot activity by using its ARD probe (Automatic Robot Detection), which is a JavaScript-based challenge that must be successfully completed in order for SiteSpect to consider web activity as coming from a human. The ARD probe is completely transparent to regular humans, but cloaked robots will typically fail the challenge. If the ARD probe fails, then SiteSpect increments the counter shown in this graph.