The ROI Report allows you to see how your investment in SiteSpect is paying off. It incorporates report images exported from Tableau and uploaded to SiteSpect by our Professional Services team.
Note: The ROI Report makes use of analytics data from Tableau. Contact our Professional Services team for more information: helpdesk@sitespect.com or +1-844-859-1900.
To view the ROI Report, select Dashboard, ROI Report.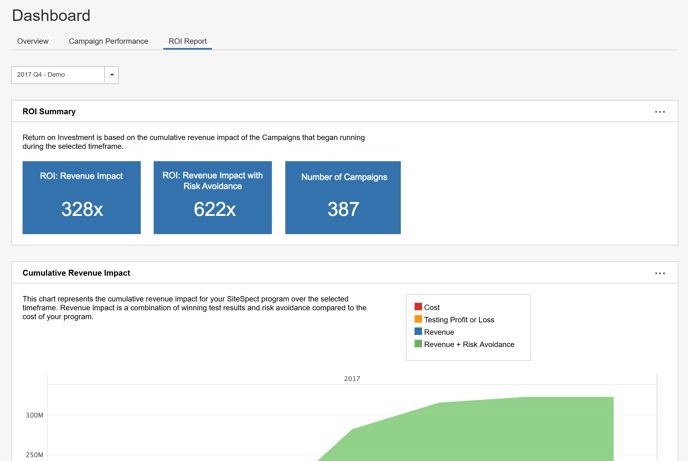
The ROI Report is broken up into three sections:
- The ROI Summary shows you the following information:
- ROI: Revenue Impact: Reports how the presence of SiteSpect has affected your bottom line. For example, if the box says 328X, which means that with SiteSpect you have earned 328 times the revenue with the presence of SiteSpect, for the selected time frame.
- ROI Revenue Impact with Risk Avoidance: Reports for the selected time frame, how the presence of SiteSpect has affected your bottom line and has helped you to avoid losing revenue without it.
- Number of Campaigns: The number of Campaigns for the selected time frame.
- Cumulative Revenue Impact: This chart represents the cumulative revenue impact for your SiteSpect program over the selected timeframe. Revenue impact is a combination of winning test results and risk avoidance compared to the cost of your program.
- Campaigns: Lists the Campaigns from the selected time frame.