SiteSpect Real User Monitoring (RUM) leverages the PerformanceTiming API to capture and record timing information for various events that occur during the loading and use of the current page. SiteSpect uses PerformanceTiming to monitor timing of the user experience on your site. This information helps you to analyze where lags in performance may be, which in turn, helps you optimize your site performance and increase conversion. Specifically, RUM helps you understand how real people interact with your site and how your site performance affects that interaction. RUM is a passive monitor, meaning that it is constantly running in the background. RUM is enabled on a per customer basis.
For example, if you suspect that your site loads too slowly, RUM can show you exactly where that lag affects user behavior. Maybe your customers behave normally up until checkout, but a slow-loading payment form causes high drop-off rates. RUM gives you the information you need to bridge the gap between performance metrics and business metrics.
Creating a Global Variation for RUM
The SiteSpect Customer Success Team must create a Global Variation that inserts some JavaScript. This JavaScript collects navigation timing information from the browser and sends it to SiteSpect. SiteSpect sends the data along with benchmark log data.
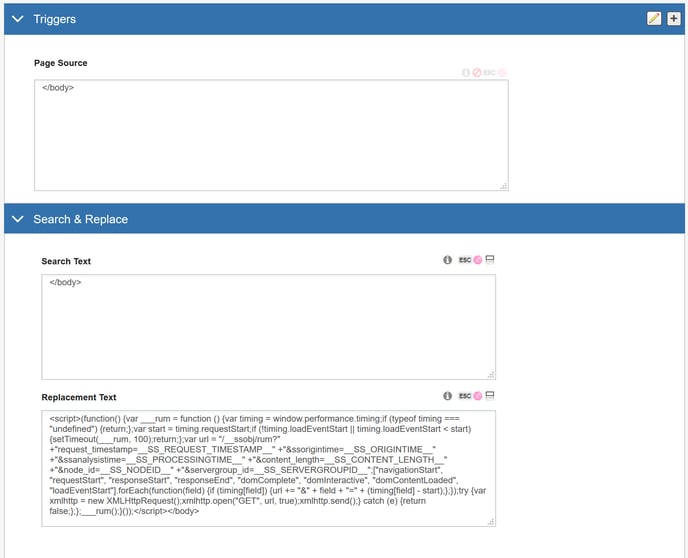
The following is an example of the replacement text that is inserted by the Global Variation RUM template:
<script>(function() {var ___rum = function () {var timing = window.performance.timing;if (typeof timing === "undefined") {return;};if (timing.loadEventStart === 0) {setTimeout(___rum, 100);return;};var start = timing.requestStart;var url = "/__ssobj/rum?" +"request_timestamp=__SS_REQUEST_TIMESTAMP__" +"&ssorigintime=__SS_ORIGINTIME__" +"&ssanalysistime=__SS_PROCESSINGTIME__" +"&content_length=__SS_CONTENT_LENGTH__" +"&node_id=__SS_NODEID__" +"&servergroup_id=__SS_SERVERGROUPID__";["navigationStart", "requestStart", "responseStart", "responseEnd", "domComplete", "loadEventStart"].forEach(function(field) {if (timing[field]) {url += "&" + field + "=" + (timing[field] - start);};});try {var xmlhttp = new XMLHttpRequest();xmlhttp.open("GET", url, true);xmlhttp.send();} catch (e) {return false;};};___rum();}());</script></body>
To create the Global Variation for RUM:
- Select New, Global Variation.
- Name the Global Variation [RUM] Data Collection.
- Click Select Tags and add a tag called #RUM.
- Select Site to make this a Site Variation.
- On the right side of the page, in the Apply Template area, click RUM to apply a RUM template. This enters the correct text for the Trigger and sets up the Find Text and Replacement Text.
- To preview the Global Variation:
- Temporarily uncheck Apply upon a request for a benchmark so the Global Variation will appear in the preview.
- Click Preview at the bottom of the page.
- Verify the data was sent.
- Exit the preview.
- Recheck Apply upon a request for a benchmark.
- Change the Status to Active.
- Click Save.
Viewing RUM Reports
To access the RUM report:
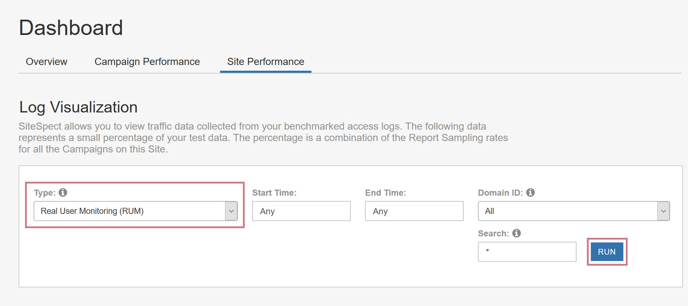
- Select Dashboard and then Site Performance.
- Select Real User Monitoring (RUM) from the Type drop-down and click Run. The page displays the RUM graphs and log data fields.
Graphs
The top part of the page displays graphs on user-monitoring data. The graphs display the following information in different combinations:
- Time to First Byte (TTFB) – The number of milliseconds between the time when a browser first requests a page to when the browser receives the first byte of the response.
- Time to Interactive – The number of milliseconds from when a browser requests a page to when the user can first interact with the page.
- Time to Last Byte (TTLB) – The number of milliseconds between the time the request started and the time the response ended.
- Page Load Time – The number of milliseconds between the time when the browser requests a page to when the browser has finished loading the DOM.
- Origin Time – The number of milliseconds between the time when SiteSpect sends a request to the web server (the origin) to the when SiteSpect receives a response from that web server.
- SiteSpect Analysis Time – The number of milliseconds it takes SiteSpect to modify the user experience.
- Content Length – The number of bytes of content.
- Time to Content Load – The time it takes for the requested content to load.
- Network Duration – The number of milliseconds between the time of the request and the time navigation begins.
SiteSpect displays the graphs in the following, in order:
Origin Time, SiteSpect Analysis Time, & Time to First Byte (TTFB)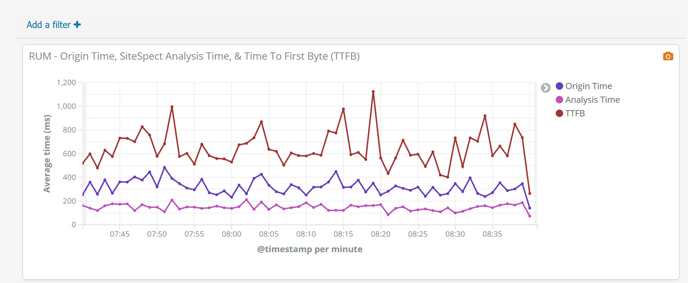
Time to First Byte (TTFB), Time to Last Byte (TTLB), & Page Load Time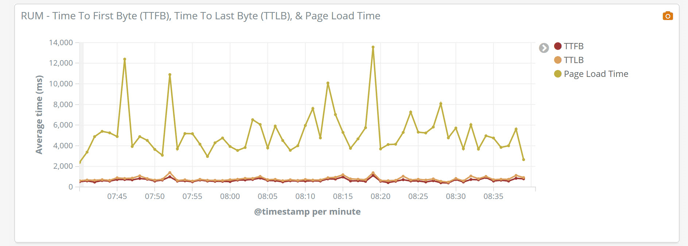
Content Length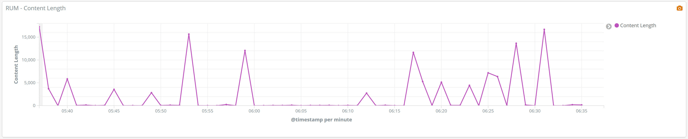
Time to Interactive, Time to Content Load, & Page Load Time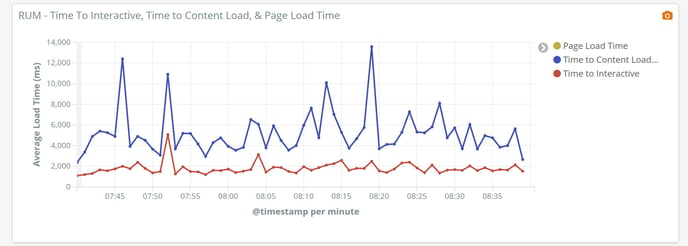
Network Duration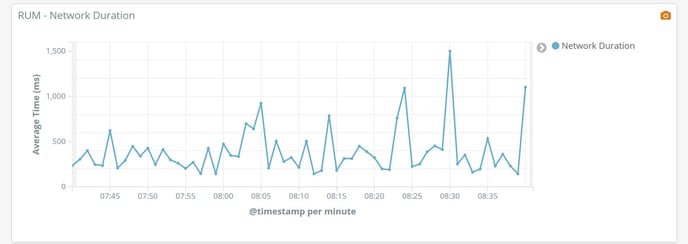
Fields
The bottom of the RUM page contains logs. The following table lists the RUM fields and their descriptions. The fields are listed in the same order in which they appear.
| Field | Description |
| metadata.type | Specifies the log file that the data comes from. In this case, it’s RUM. |
| timestamp | The time of the request in the UTC time zone. |
| assignments | A comma delimited list of the Campaigns this visitor is assigned to. Each value in the list has three parts separated by colons: testcampaign_id, variationgroup_id and counted (0 means not counted in the Campaign, 1 means counted). For Campaigns that use the Visited URL Audience, users who are eligible for the Campaign but are not yet fully assigned (because they haven't yet reached the Visited URL page) see a special value in this field such as E(1234) meaning that they are eligible for campaign 1234, but are not yet assigned. |
| beacon_node_id | The node that received the ajax request. |
| beacon_servergroup_id | The server that served the actual page. |
| content_length | The number of characters received from the origin. |
| domComplete | The time immediately before the user agent sets the current document readiness to 'complete'. It means that the page and all of its subresources are ready. All of the processing is complete and all of the resources on the page (images, etc.) have finished downloading and the loading spinner has stopped spinning. |
| domInteractive | The time (in milliseconds) it takes SiteSpect to process the request and response. |
| domain_id | The Domain ID that served this request. |
| geo | The location of the request. |
| host_fqdn | The fully qualified domain name (FQDN) of the host. The complete domain name for a specific computer, or host, on the internet.. |
| is_preview | Determines if this is a preview. |
| loadEventStart | The moment (in milliseconds since the UNIX epoch) when the load event was sent for the current document. If this event has not yet been sent, it returns 0. |
| logzio_codec | The format of the logs, which is always JSON. |
| navigationStart | A user initiated event beginning the process of going to a web page or resource. The very beginning of the user interaction with the browser. |
| node_id | The node_id for the engine that served this request. |
| requestStart | The starting point of an HTTP request/response transaction. Everything that has happened before the requestStart time involved finding the resource and establishing a connection. When we reach requestStart the HTTP request for a resource actually takes place. |
| responseEnd | The moment (in milliseconds since the UNIX epoch) when the browser received the last byte of the response, or when the connection is closed if this happened first, from the server, cache, or local resource. |
| responseStart | The moment (in milliseconds since the UNIX epoch) when the browser received the first byte of the response from the server, cache, or local resource. |
| servergroup_id | The ID of the server group that served this request. This is used to look at data center breakdowns for traffic. |
| site_id | The Site that served this request. |
| ssanalysistime | The time (in milliseconds) that SiteSpect spent analyzing the response (running Variations, capturing Metrics, and so on). |
| ssorigintime | The time (in milliseconds) it takes for the request to travel from SiteSpect to the Origin and then back to SiteSpect. This is a round trip time. |
| time_to_beacon | The time between the browser sending a beacon and SiteSpect receiving it. |
| type | The log type, either access or RUM. |
| url | The URL that was requested. |
| user_agent | The user agent in this request. |
| user_guid | The SiteSpect GUID for the user in this request. |