The Campaign Results Report combines trend and matrix data giving you at-a-glance analysis and results monitoring. The trend data offers a quick, accessible, understanding of the stability of your results over time. The matrix lets you see multiple side-by-side views of Metrics so that you can see the affect of your Campaigns across the customer experience. The report loads fast, making small and large Campaigns easy to analyze. No matter how many visitors your Campaign gets, your report loads immediately; you won’t have to wait on your important Metrics.
To view the report:
- Select Campaigns and then locate the Campaign you want to report on.
- Click the name of the Campaign to open it.
- Click Analytics in the left nav. The Analytics page opens displaying the Campaign Results Report.

Trend Graph
The graph has various settings that allow you to determine what is displayed.
Segments
At the top right side of the page is a drop-down that allows you to select specific Segments. Click All to examine the available Segments. Select as many as you'd like to see or select All.
Date Range
At the top right side of the page is a menu that allows you to specify a date range for the report. Leaving the Date fields blank includes all dates.
Metric Selection
Select one of the Metrics from the drop-down. The selected Metric is displayed on the Trend graph.
Data Points
Select Totals or Uniques. Totals, the default Data Point, tracks the total number of times a user triggers the Metric during a visit. Uniques tracks whether or not the Metric was hit during a visit. Any visit including at least one hit to the Metric has a Uniques value of 1; otherwise the value is 0.
Trend to Display
Select % Change or Average. The graph can display the % Change between the Control and the Variation Groups or the Average for a given Metric, for example, the average purchase rate, average add to cart rate, average number of page views, and so on.
Density of Data
Select to display all Cumulative data over the length of the graph or to display it in Daily increments.
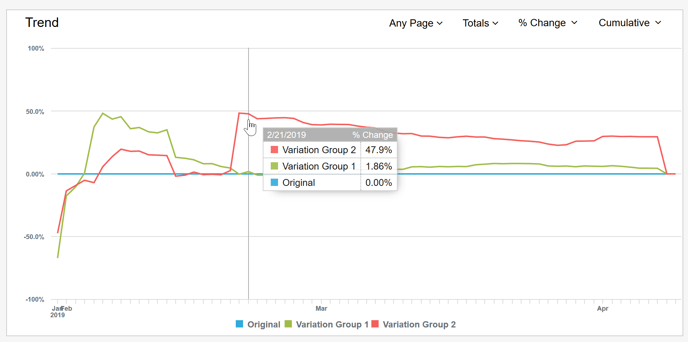
Trend Detail Popup
The Trend graph displays a pop-up when you hover over the graph lines, giving you specific details at a point in time. For example, the following shows the Trend pop-up displaying the % Change when each Variation Group is compared to the Original (Control).
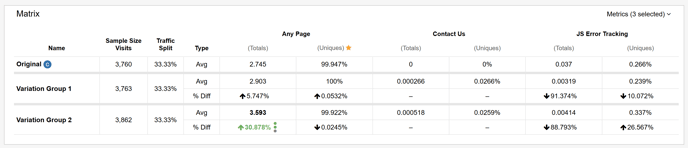
Matrix
The Matrix section of the report presents details about your Metrics in table format. A drop-down on the right side of the table allows you to select which Metrics you want to display. The first two columns of the Matrix display Sample Size in Visits and Traffic Split between the Original and the Variation Groups. To the right are pairs of columns for each selected Metric. For example, the following Matrix displays data for Metrics called Any Page, Contact Us, and JS Error Tracking.
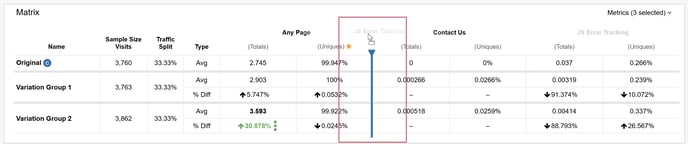
You can rearrange the order of the Metrics by clicking on the Metric name and dragging to the left or right. A blue indicator shows you where you are moving the two-column Metric.