Log files record the raw web hits made to a Site over time and help with additional analysis. Log files are available for the most recent 30 days.
To request a log file:
- Select Site, Monitoring, and then Log Files.
- Select a valid time frame and then click New File. Note that all times and dates within the log files are specified in the UTC time zone.
The files are created in JSON format. This allows other tools and platforms such as an ELK Stack service like Logz.io to more easily import your data. JSON is a more structured and easier format to process. The following is an example of the format.
"node_id":"156",
"cluster_id":"2",
"servergroup_id":"7",
"servergroup_name":"San Jose, CA, USA",
"timestamp":"1559261463",
"siteidentity_id":"098765",
"domain_id":"198765",
"site_id":"298765",
"processing_time":"1346836",
"date":"[31/May/2019:00:11:03 +0000]",
"url":"/",
"status":"200",
"bytes":"5772",
"user_guid":"098765098765098765",
"visit_count":"1",
"proxied_request":"1",
"proxy_time":"1.326",
"proxy_rate":"0.011",
"analysis_time":"0.018",
"analysis_rate":"0.281",
"testable":"2",
"ip":"123.123.123.123",
"method":"GET",
"user_agent":"Mozilla/5.0
    (X11; Ubuntu; Linux x86_64; rv:62.0) Gecko/20100101 Firefox/62.0",
"http_referer":"-",
"cache_status":"0",
"log_entry_type":"TESTABLE",
"raw_bytes":"15554",
"num_campaigns":"3",
"num_rps":"7",
"num_variationhits":"3",
"num_sitevariationhits":"3",
"conversion":"-",
"sitespect_flags":"VA",
"usermanagement_time":"0.0054",
"selectrpv_time":"0.0069",
"contentfunctions_time":"0.0113",
"si_counter":"1",
"si_average":"0",
"si_status":"normal",
"visit_pageviews":"1",
"hit_rating":"0",
"visit_rps":"7",
"visit_variationhits":"3",
"visit_valuecapture":"0",
"sum_valuecapture":"0",
"assignments":"098765:198765:1,298765:398765:1,498765:598765:1",
"benchmark_weight":"1",
"hostname":"www.sitespect.com",
"connection_status":"-",
"x_forwarded_for":"-",
"pid":"25980",
"fe_keepalive_reqs":"0",
"backend_ip":"124.124.124.124:80",
"new_backend_conn":"1",
"error_string":"-",
"proxy_retry":"-",
"ancillary_value":"-",
"ard_injected":"1",
"visit_start":"1",
"shedded":"-",
"release_order":"third",
"site_name":"SiteSpect, www.sitespect.com",
"reached_overlay_cap":"0",
"cache_status_env":"s-maxage or max-age zero and no Last-Modified or
    Etag; not cacheable"
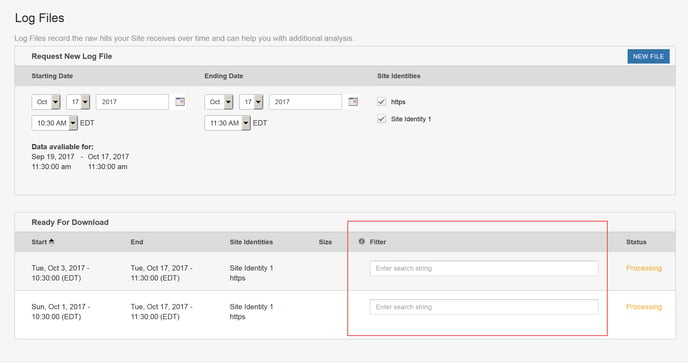
Filtering the Log File
You can use a string to filter the log file. To do so, enter a string in the Filter field, as shown in the following image.
Log File Fields
The following table lists the fields in the log file and their descriptions. The fields are listed in the same order in which they appear in the file.
| node_id | The node_id for the engine that served this request. |
|---|---|
| cluster_id | The ID of the cluster. For SiteSpect Cloud, this is set to 1. |
| servergroup_id | The ID of the server group that served this request. This is used to look at data center breakdowns for traffic. |
| servergroup_name | The name of the server, expressed as city, state, country. |
| timestamp | The time of the request in the UTC time zone. |
| siteidentity_id | The Site Identity that served this request. |
| domain_id | The Domain ID that served this request. |
| site_id | The Site that served this request. |
| processing_time | The total amount of time (in microseconds) that SiteSpect spent on this request. It's the whole round trip from when SiteSpect receives the first byte of the user's request until SiteSpect sends the last byte of the response. It includes proxy_time and analysis_time. Note that this field is populated only if SiteSpect has selected the request for benchmarking. |
| date | The date of the request in the UTC time zone. |
| URL | The URL that was requested. |
| status | The HTTP status code. |
| bytes | The number of bytes in the request. |
| user_guid | The SiteSpect GUID for the user in this request. |
| visit_count | The SiteSpect visit count for the user in this request. |
| proxied_request | Set to 1 if this request was proxied to the origin and 0 if this request was served by SiteSpect. This is useful for troubleshooting proxy errors generated by SiteSpect. |
| proxy_time | The time in seconds that SiteSpect spent proxying the origin. This is also called origin time. |
| proxy_rate | The rate at which SiteSpect is communicating to the origin. The units are KB/ms. |
| analysis_time | Time in seconds that SiteSpect spent analyzing the response (running Variations, capturing Metrics, and so on). |
| analysis_rate | The rate at which SiteSpect analyzes the response (running Variations, capturing Metrics, etc.). The units are KB/ms/number of Campaigns. |
| testable | This field can have one of three values: 0 (untestable), 1 (can capture Metrics but can't make changes), 2 (can capture Metrics and can make changes). |
| ip | The client's IP. |
| method | The HTTP method for this request. |
| user_agent | The user agent in this request. |
| http_referer | The referring URL for this request. |
| cache_status | Indicates if the browser can cache the page. |
| log_entry_type | Indicates whether the response was eligible for processing by SiteSpect (TESTABLE), whether it was passed through without being processed (PASS_*), or whether it's a non-human page request (ROBOT) which is written when the user has failed the SiteSpect robot test. |
| raw_bytes | The size of the response. |
| num_campaigns | The number of Campaigns this request is assigned to. This is useful when trying to gauge the effect of overlay performance. |
| num_rps | The number of Metrics that were triggered on this request. |
| num_variationhits | The number of Variations that were applied on this request. |
| num_sitevariationhits | The number of Site Variations that were applied on this request. |
| conversion | Indicates the state of the conversion URL. 1 means conversion and 0 means non-conversion. |
| sitespect_flags | Indicates what happened during this visit:
? - SiteSpect spent 0 time in user management
V - Create new active user visit X - Check Campaign expiration A - Attempt new Campaign assignment |
| usermanagement_time | Time spent in user management. This is the time spent assigning a user to a Campaign (audiences, overlay, etc.) and checking to make sure they are no longer in ended Campaigns. |
| selectrpv_time | The time it takes SiteSpect to pull Metrics, Variations, and Global Variations from the database. |
| contentfunctions_time | The time it takes SiteSpect to execute Metrics, Variations, and Global Variations. |
| si_counter | Used by SiteSpect for slow origin detection. |
| si_average | Used by SiteSpect for slow origin detection. |
| si_status | Used by SiteSpect for slow origin detection. |
| visit_pageviews | The number of pages viewed during this visit. |
| hit_rating | The Visit Rating for the current user's session. |
| visit_rps | Total Metrics triggered in this visit. Assumes that the Logging Level is set to Debug for the Domain. |
| visit_variationhits | Total Variations applied in this visit. Assumes that the Logging Level is set to Debug for the Domain. |
| visit_valuecapture | Sum of Value Captures for this visit. Assumes that the Logging Level is set to Debug for the Domain. |
| sum_valuecapture | Sum of Value Captures for this visit. |
| assignments | A comma delimited list of the Campaigns this visitor is assigned to. Each value in the list has three parts separated by colons: testcampaign_id, variationgroup_id and counted (0 means not counted in the Campaign, 1 means counted). For Campaigns that use the Visited URL Audience, users who are eligible for the Campaign but are not yet fully assigned (because they haven't yet reached the Visited URL page) see a special value in this field such as E(1234) meaning that they are eligible for campaign 1234, but are not yet assigned. |
| benchmark_weight | A projection of the number of requests benchmarking out of 100 based on the benchmark rate set in SiteSpect. If a benchmark rate is 5%, then benchmark_weight is 20. A value of 0 indicates a healthcheck request that wasn't picked for benchmarking. A value of '-' indicates a request that wasn't picked for benchmarking. |
| hostname | The domain the request was sent to. |
| connection_status | Connection status when the response is completed:
X - The connection aborted before the response completed.
+ - The connection may be kept alive after the response is sent. - - The connection will be closed after the response is sent. |
| x_forwarded_for | Because SiteSpect is a proxy, it relays requests toward the origin. This field contains the client IP then the IP address of any proxy on the way to the origin. |
| pid | The internal ID of the process that handled this request. |
| fe_keepalive_reqs | The number of keepalive requests handled on this connection after the initial request. |
| backend_ip | The IP address to which SiteSpect relays the request. This is the origin or the client’s CDN. |
| new_backend_conn | Indicates whether a connection was reused (0) or a new connection was made (1). |
| error_string | In case of error, if an error text is generated, it appears in this field. |
| proxy_retry | SiteSpect can retry proxy errors that happened with a GET method and took less than 10 seconds. This feature is configured on a per engine basis and is off by default. The value is 1 when a retry was performed and '-' when a retry was not done. |
| ancillary_value | The value of the ancillary cookie or if undefined, '-'. |
| ard_injected | Indicates if the automatic robot detection test is injected (1) or not (0). |
| visit_start | Indicates if this request is the beginning of a client’s session (1) or not (0). |
| shedded | Indicates if the request is marked for shedding (1) or not (0). |
| release_order | The setting in the Release Order field for the Domain. |
| site_name | The name of the Site. You can see this in the SiteSpect User Interface along the top bar at the right side of the page. |
| reached_overlay_cap | Indicates whether or not your Site has reached its setting for Concurrent Assignment Ceiling on the Site Settings tab (1) or not (0). |
| cache_status_env | Indicates how the response was served. |